Developing browser extensions with Visual Studio Code
Reupload of my posts from Blogspot from 10-Sep-20
Hello, World!
Not so far ago I wrote an article about making a Chromium extension. And now I'd like to tell you about debugging tools which I use to do this. Besides it seems that there're just few articles about the topic and none about developing in VS Code
So, let's dive in
Prerequisites
First of all, further in the article I will assume that you already know about concepts of WebExtension development and have at least a prototype of one since this is a post about not coding but debugging
So, what we'll need:
- Visual Studio Code Editor
- WebExtension or Chrome extension project
- Firefox browser
Now you'll probably going to ask: "Can I use Google Chrome or any other browser". The answer is: "No, you cannot". Unfortunately, Google Chrome debugging tools for VS Code currently don't support extensions debugging. But honestly, if they even do, I'd still recommend you to use Firefox at least because it has more flexible built-in developer's console
So, that's it. Let's move to the setup
Environment setup
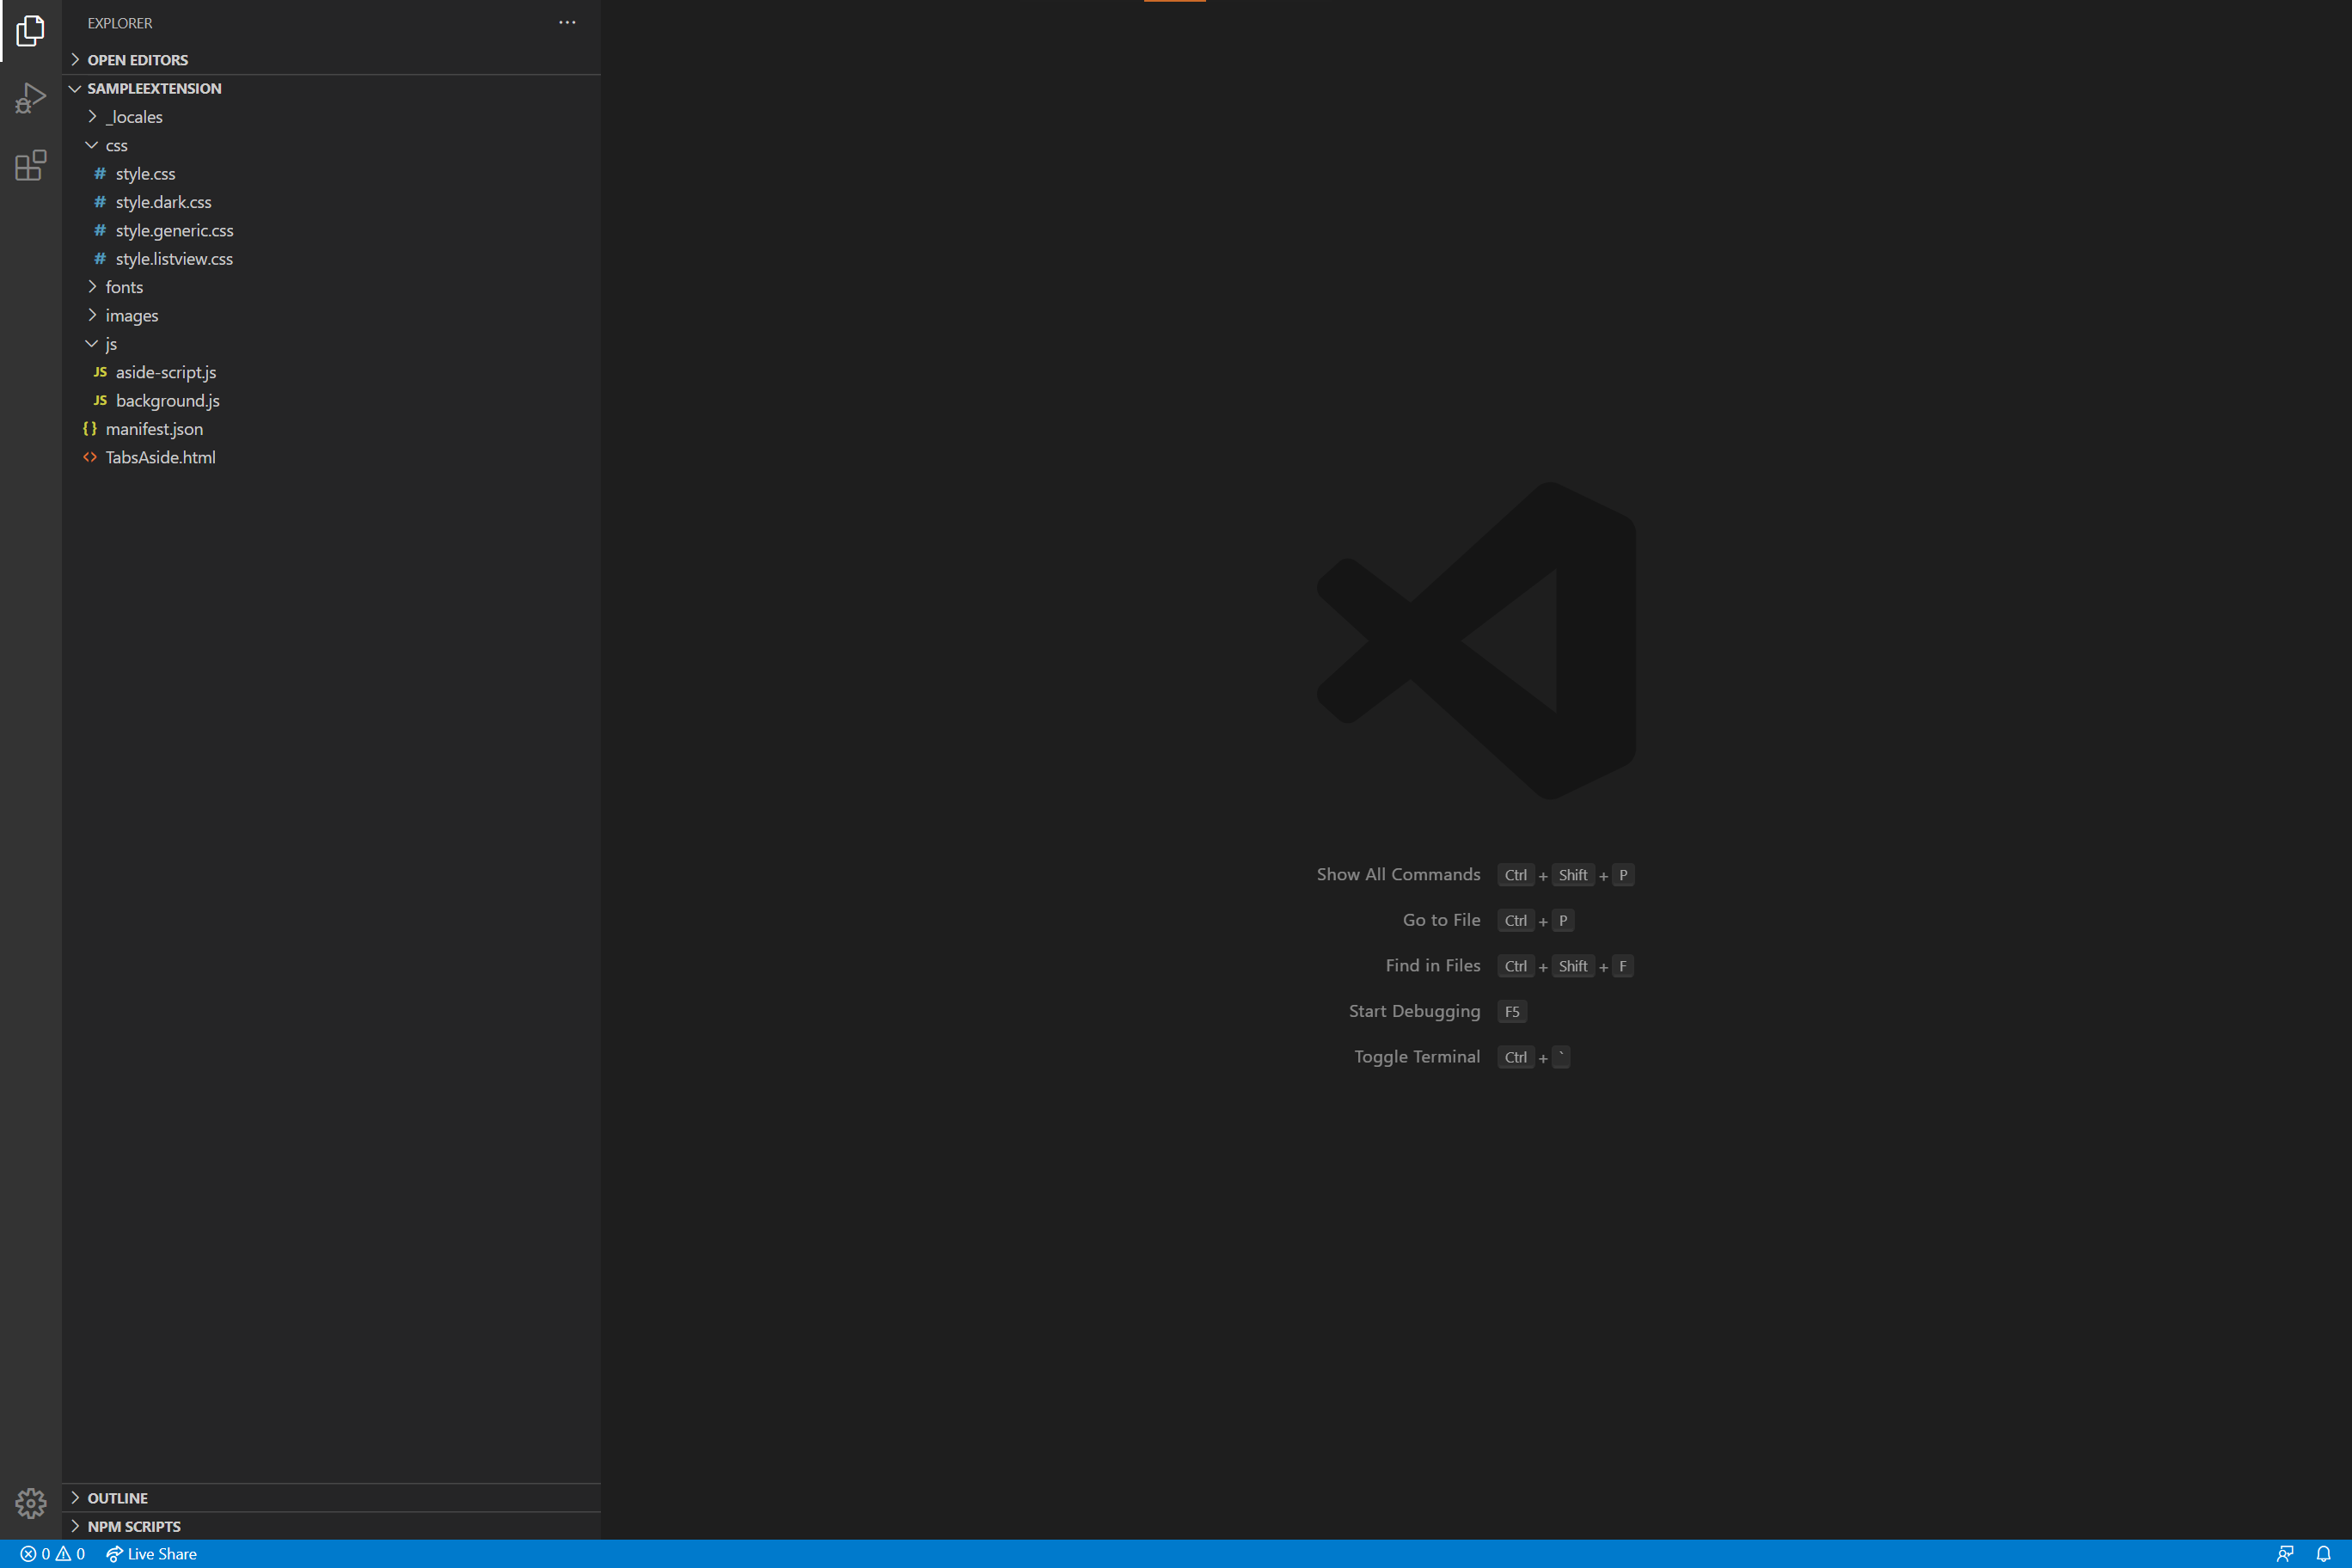
Let's open our project's workspace. This step is optional and can be done anytime but let's just do it now
So, your editor should be looking like this:
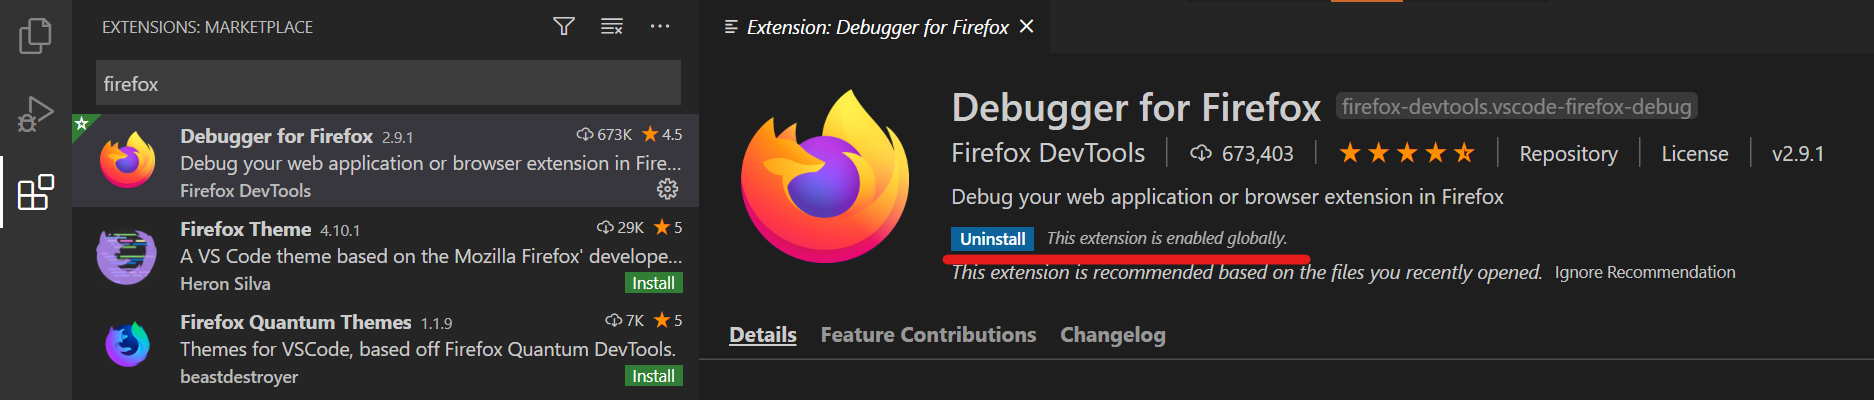
Now we need to open "Extensions" tab and install "Debugger for Firefox". Just type into the search bar "Firefox" and it will be the first one on the list
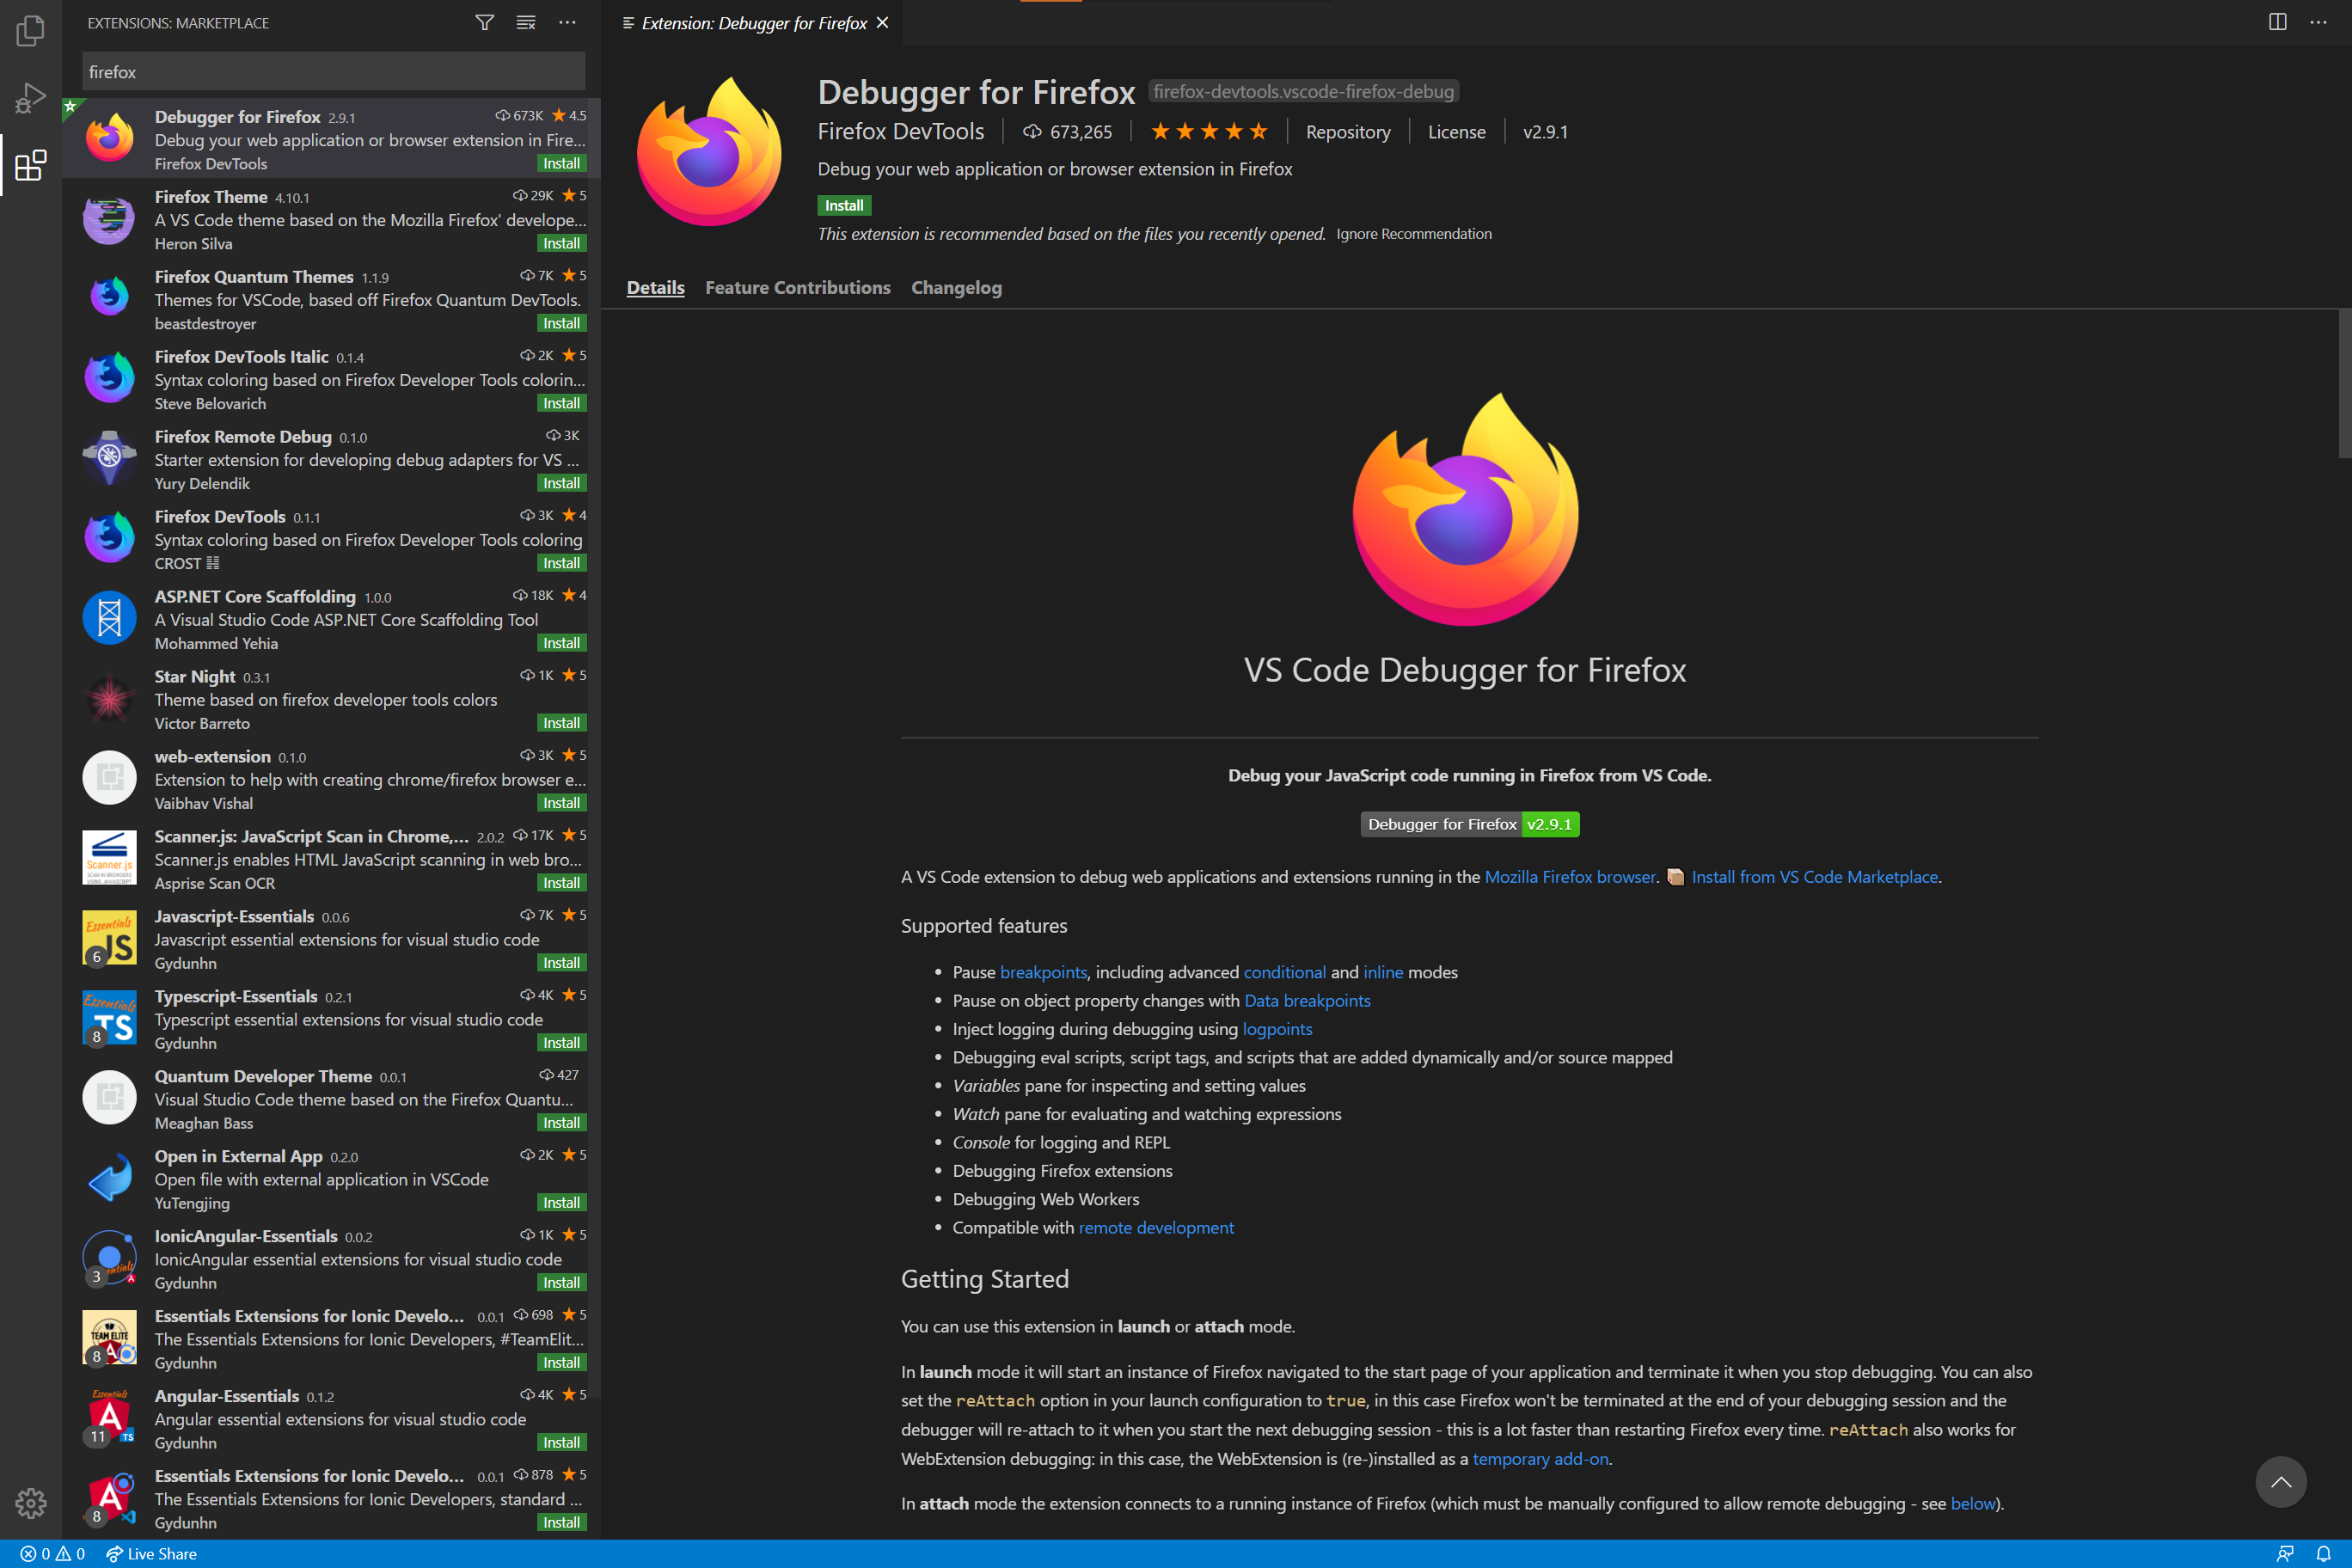
Now we need to open "Extensions" tab and install "Debugger for Firefox". Just type into the search bar "firefox" and it will be the first one on the list
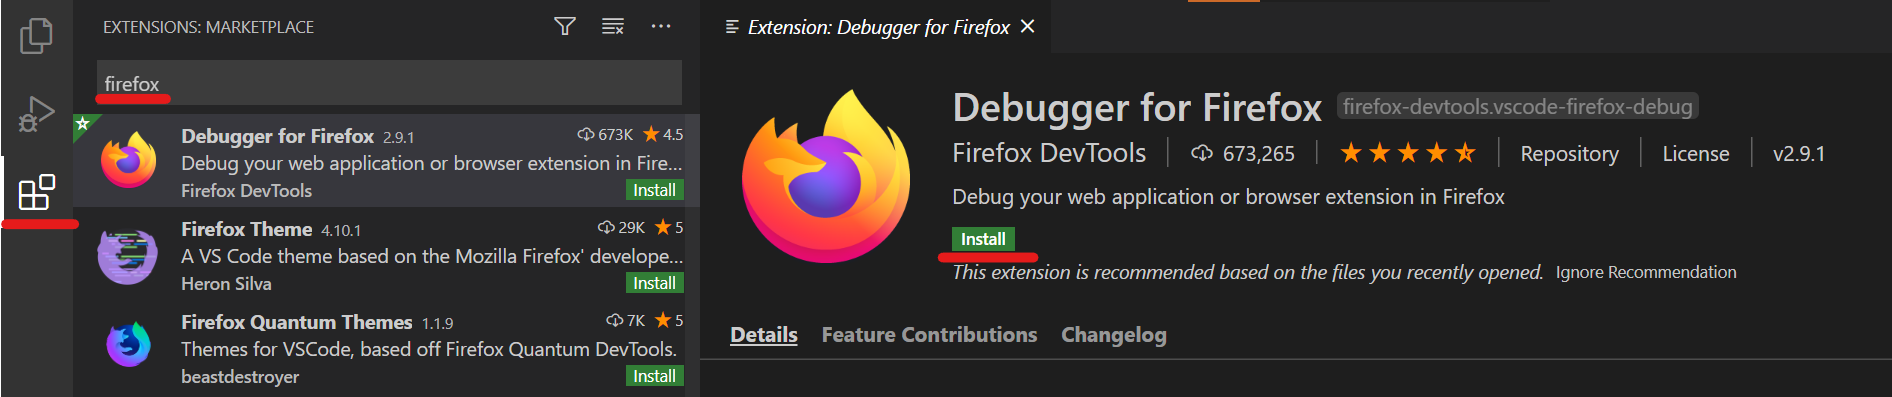
Just click "Install" and wait for a few seconds
Environment is now set up. Let's move to configuration
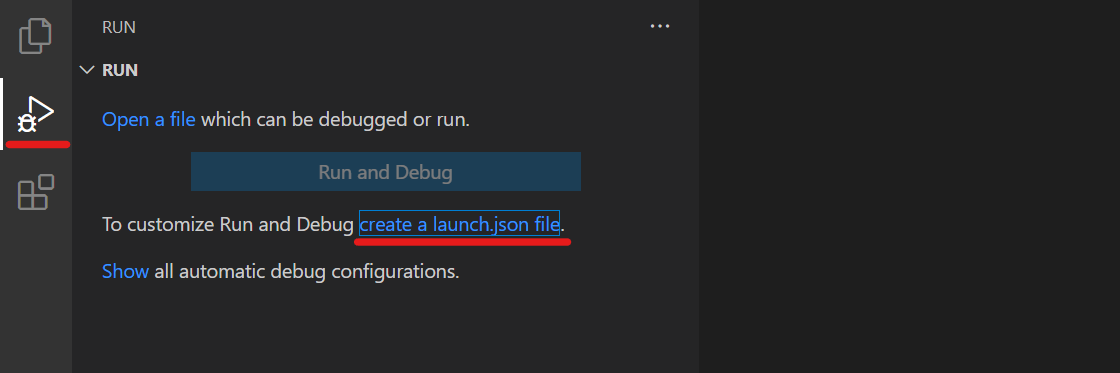
Navigate to debug tab and hit "create a launch json file"
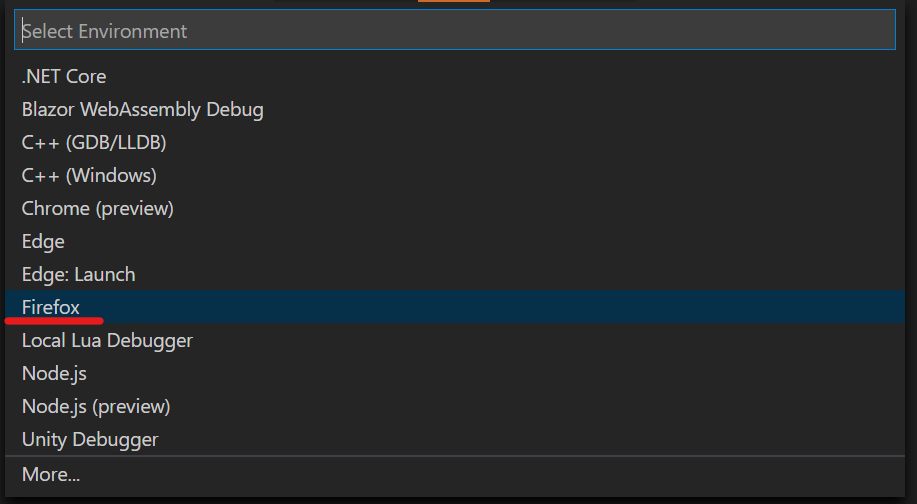
After some initialization work VS will ask you to choose your environment. Select "Firefox"
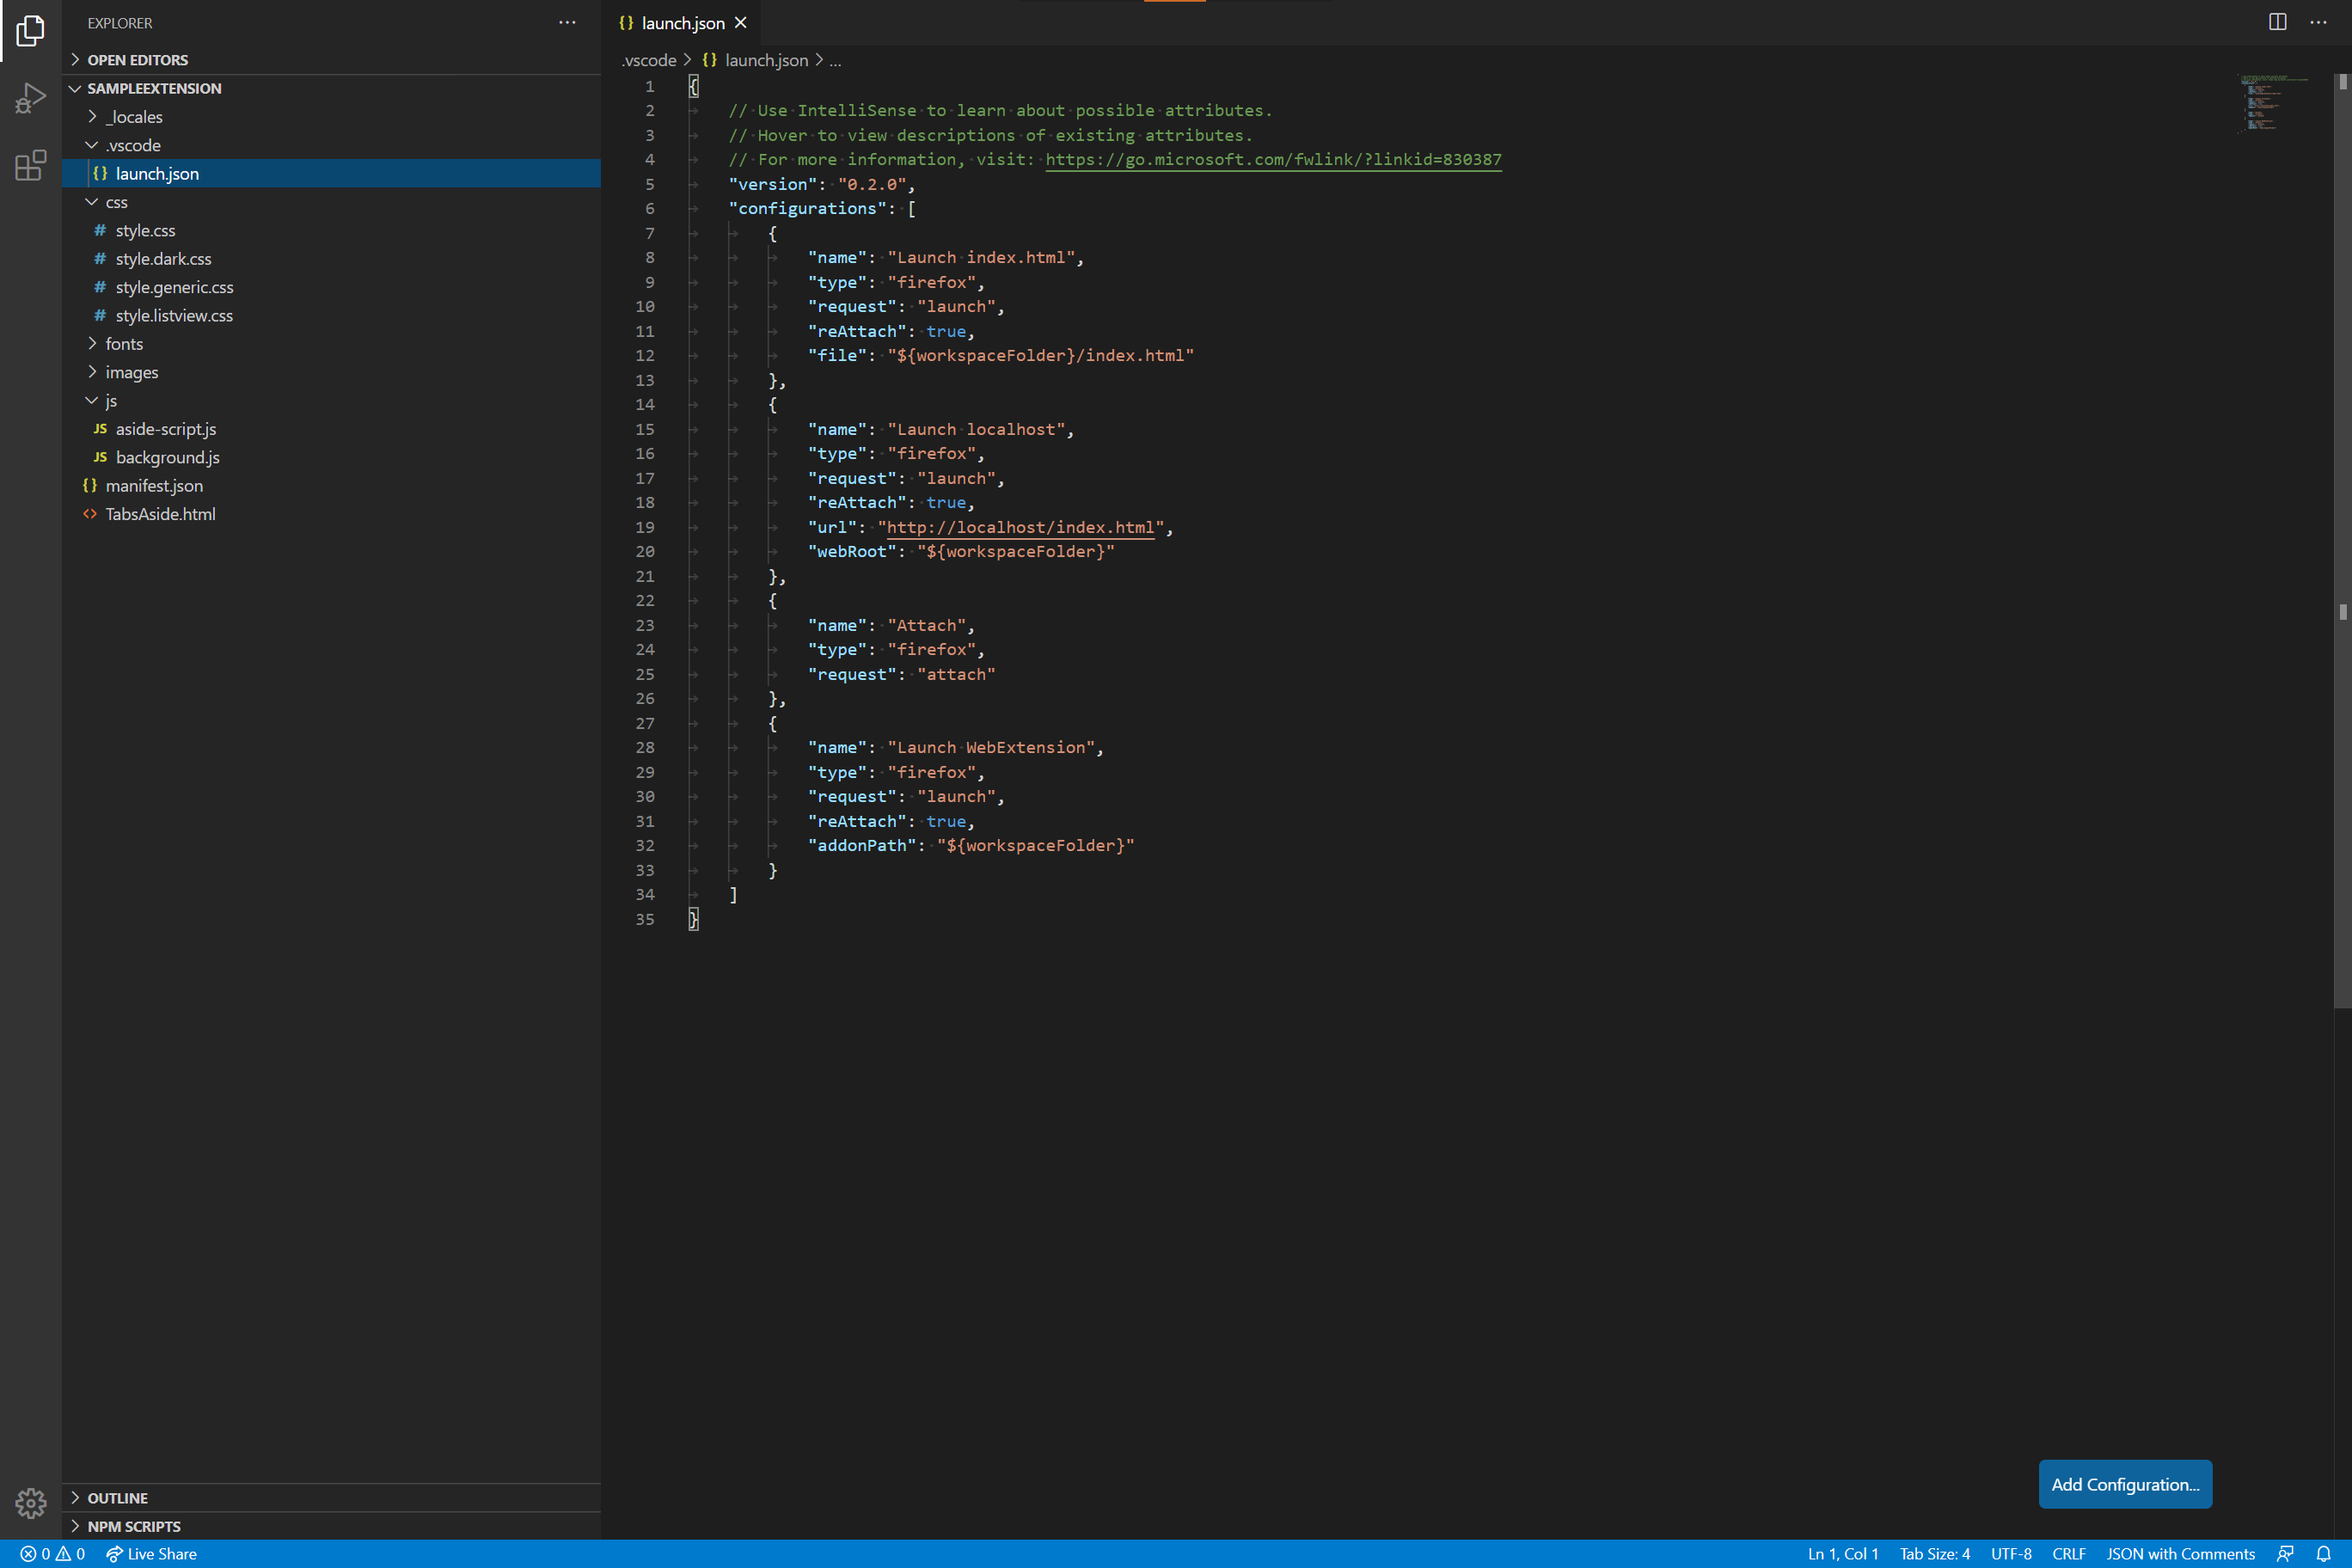
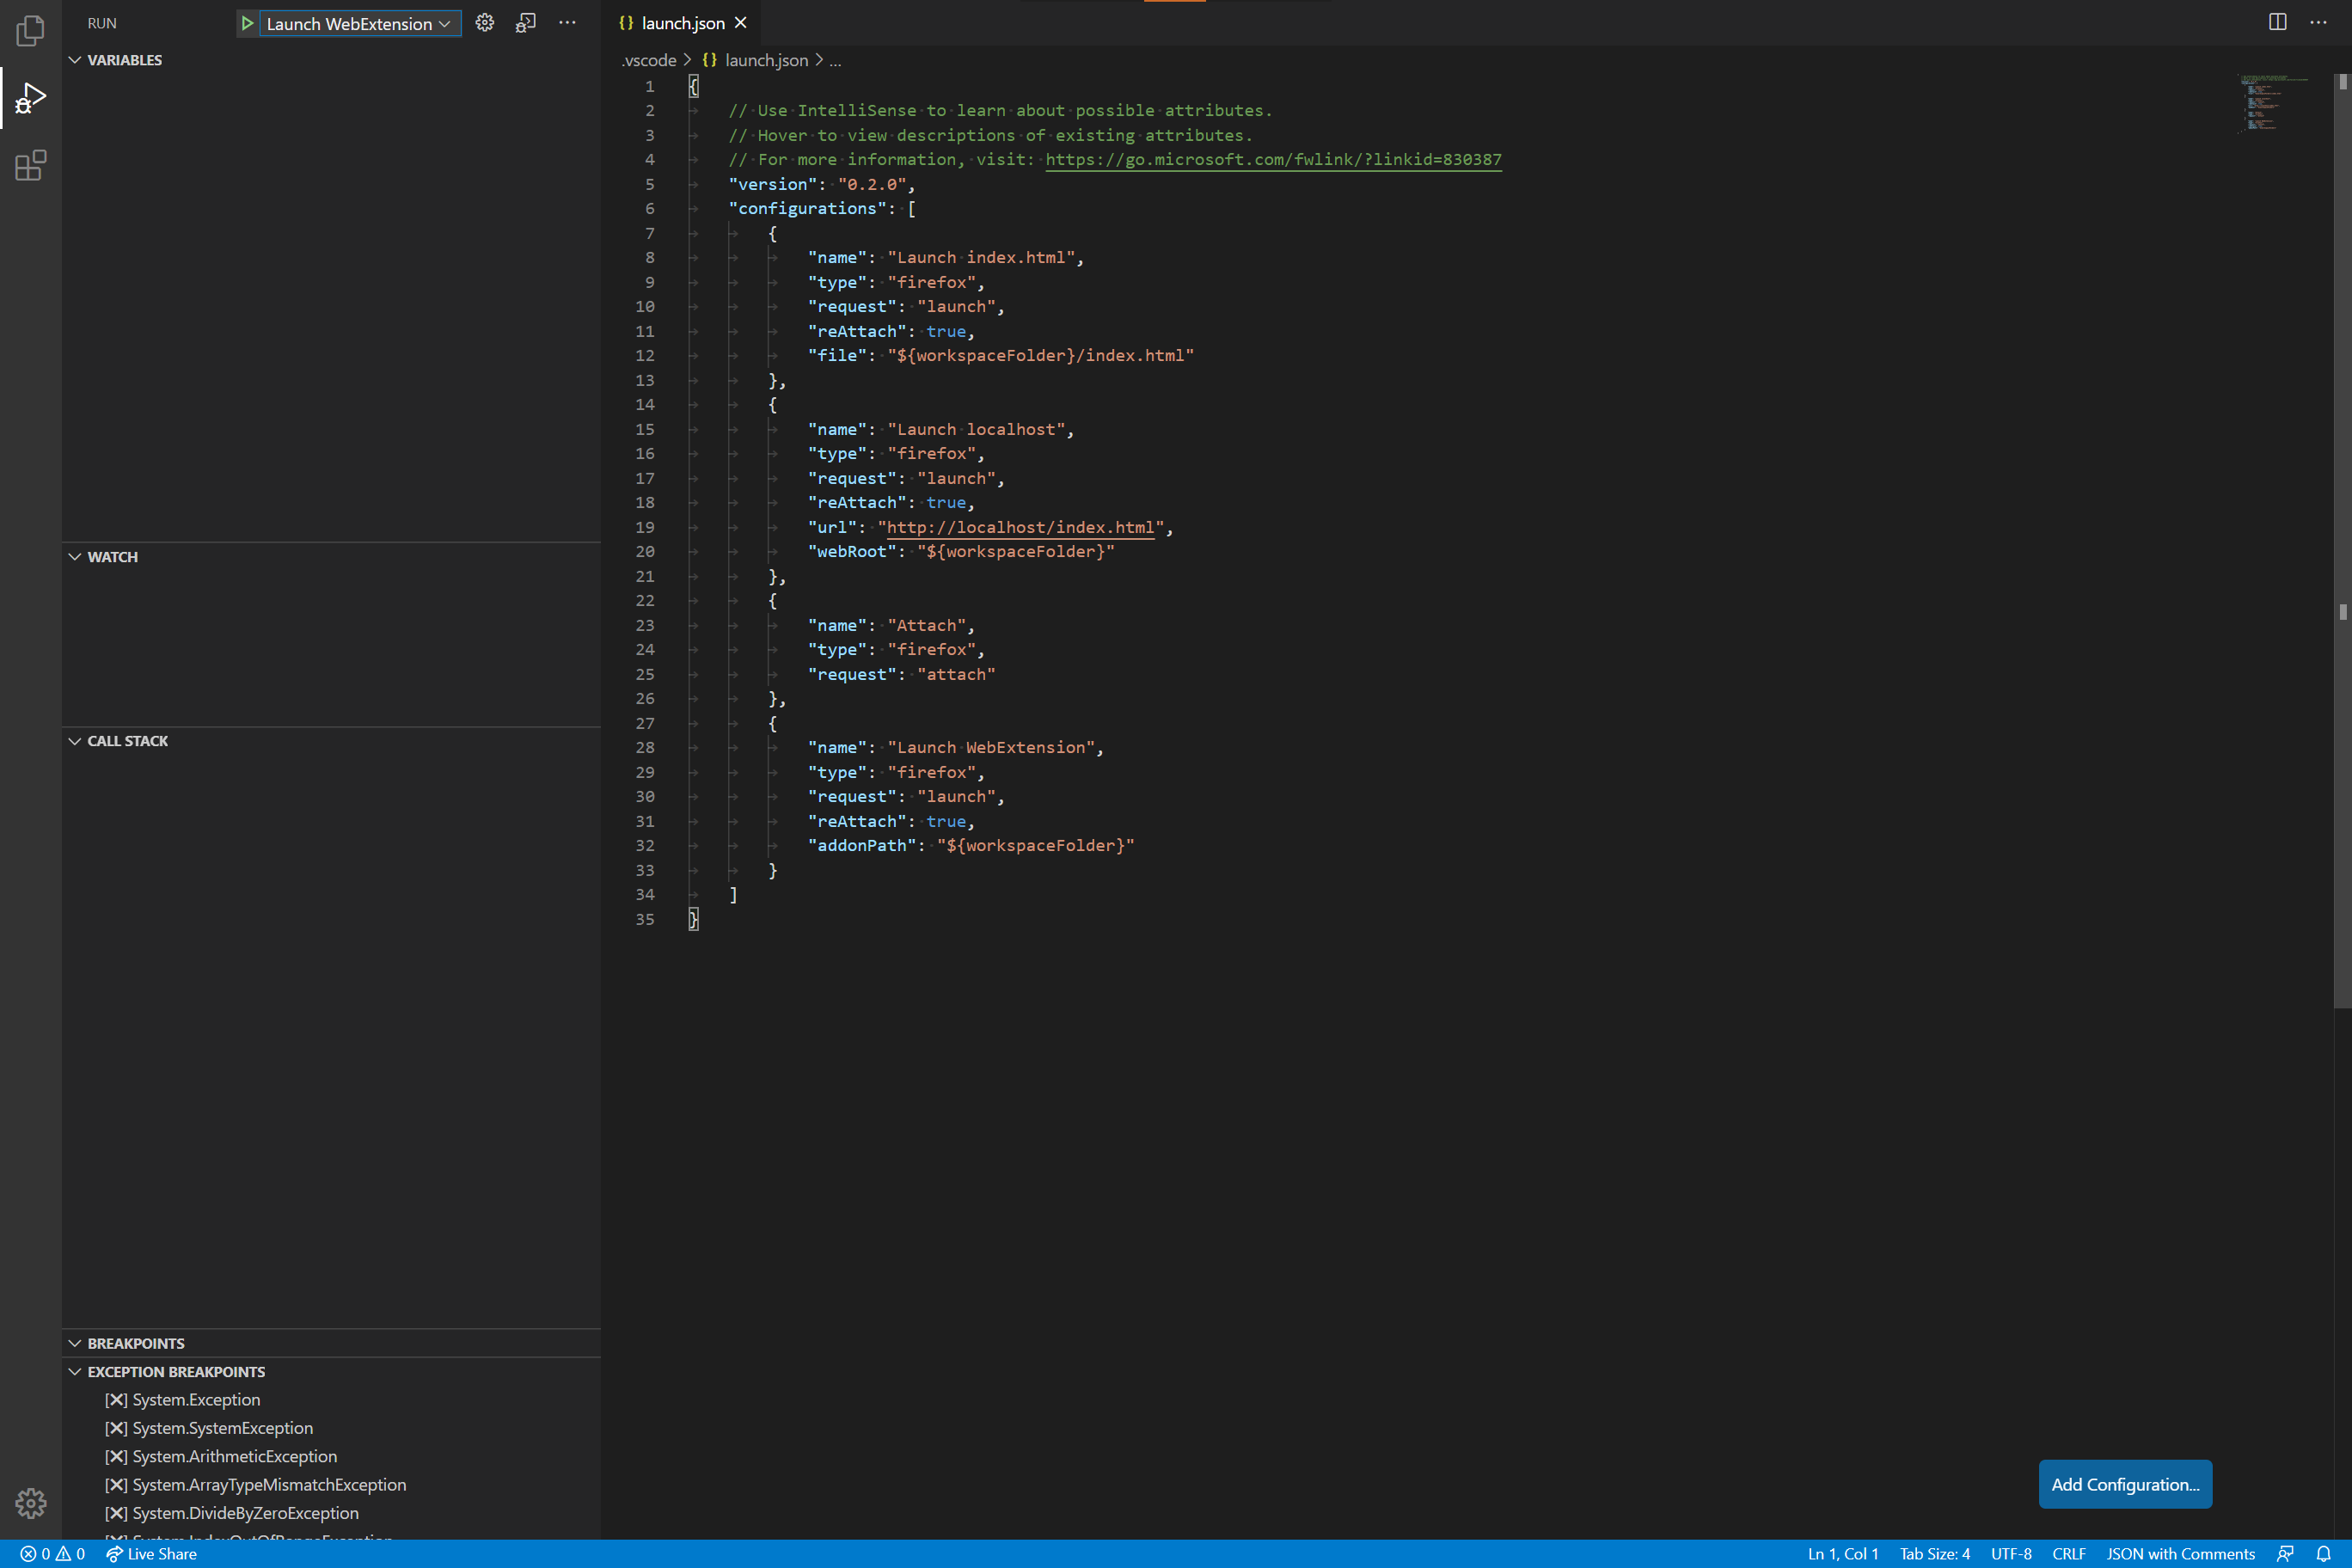
This action will create debug configuration file launch.json with several pre-defined configurations: Launch index.html, Launch localhost, etc.
If you want, you can remove all configurations but Launch WebExtension since it's the only configuration we will use in the project
Now if we go back to Debug tab, we'll see that it now has standard debugging sections
Now we're ready to go!
Debugging
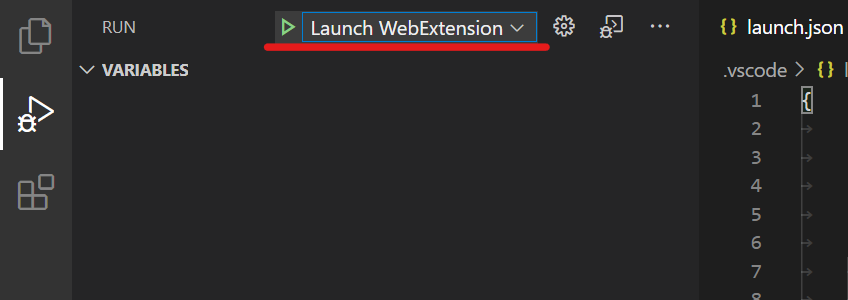
Let's try to launch debugger. Make sure you've set "Launch WebExtension" as a default launch task and press "Start Debugging" (or press F5 on your keyboard)
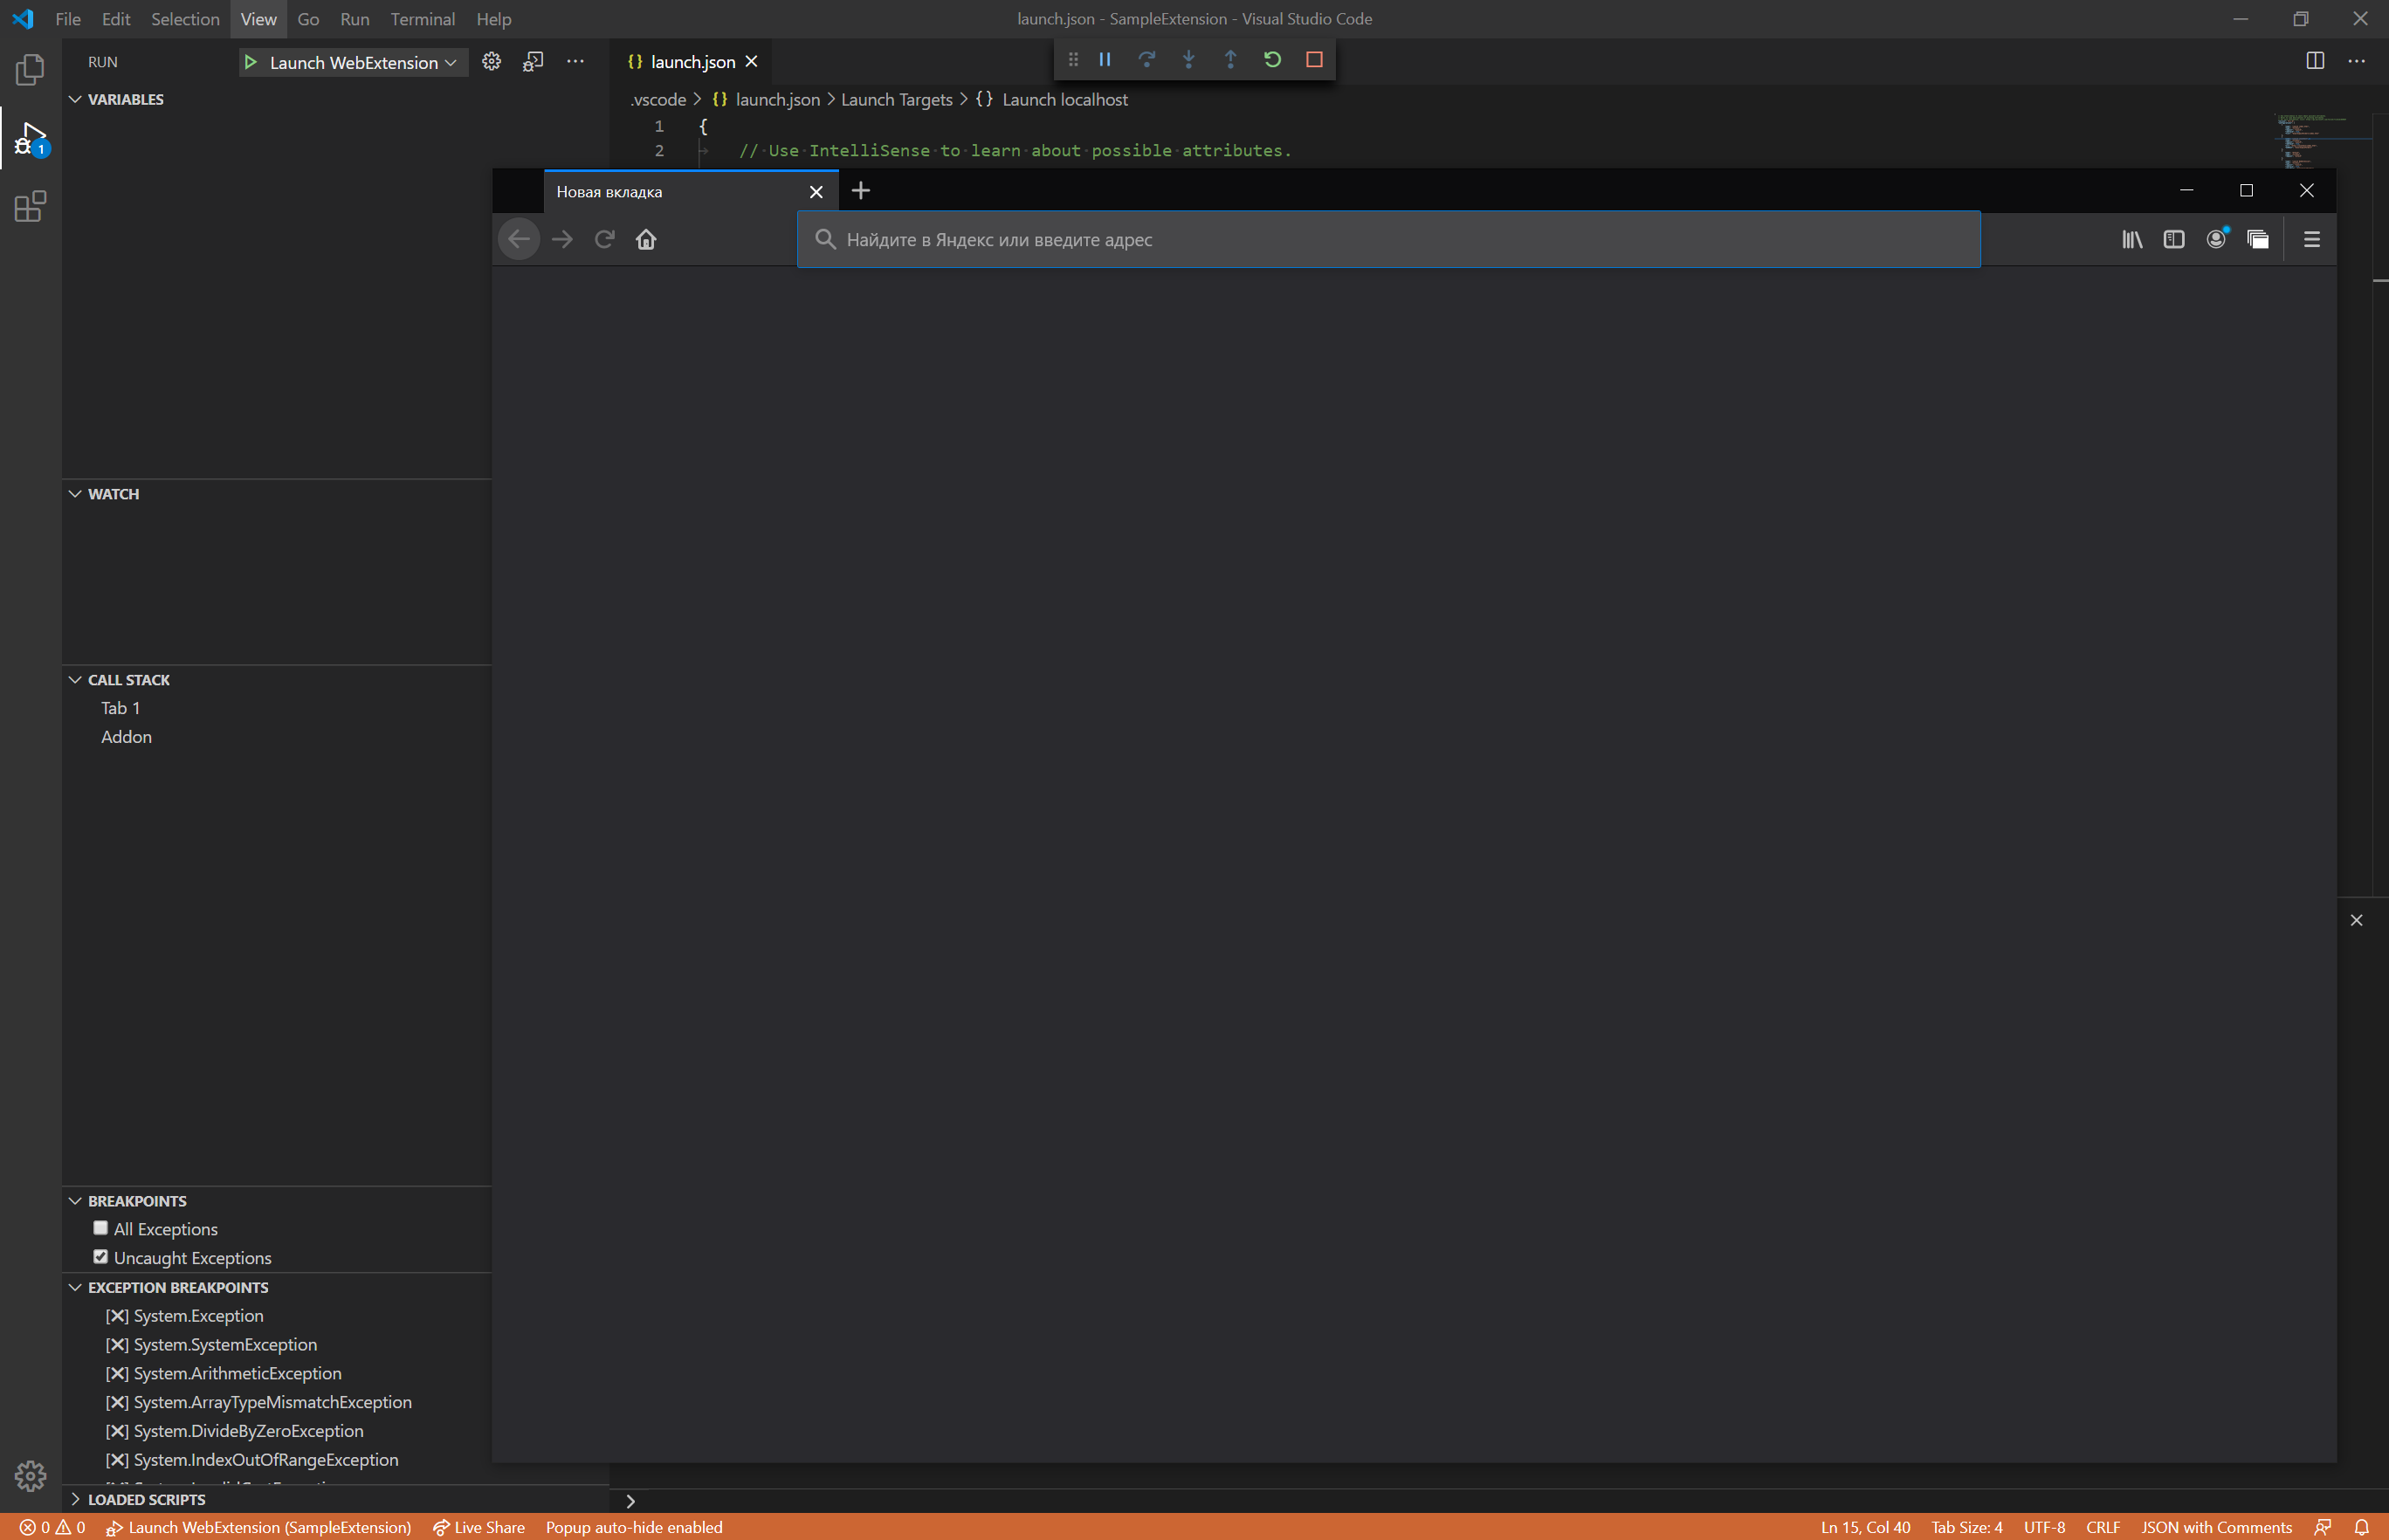
You'll see now debugging tools being launched and Firefox browser being launched in debug mode. This mode suggests that the browser runs in some sort of container and any changes won't affect your actual environment
Now let's put some breakpoints, add a watch statement and some console.log() functions and relaunch debugging session. And when your breakpoint is hit, you'll see all data available at the moment to debug
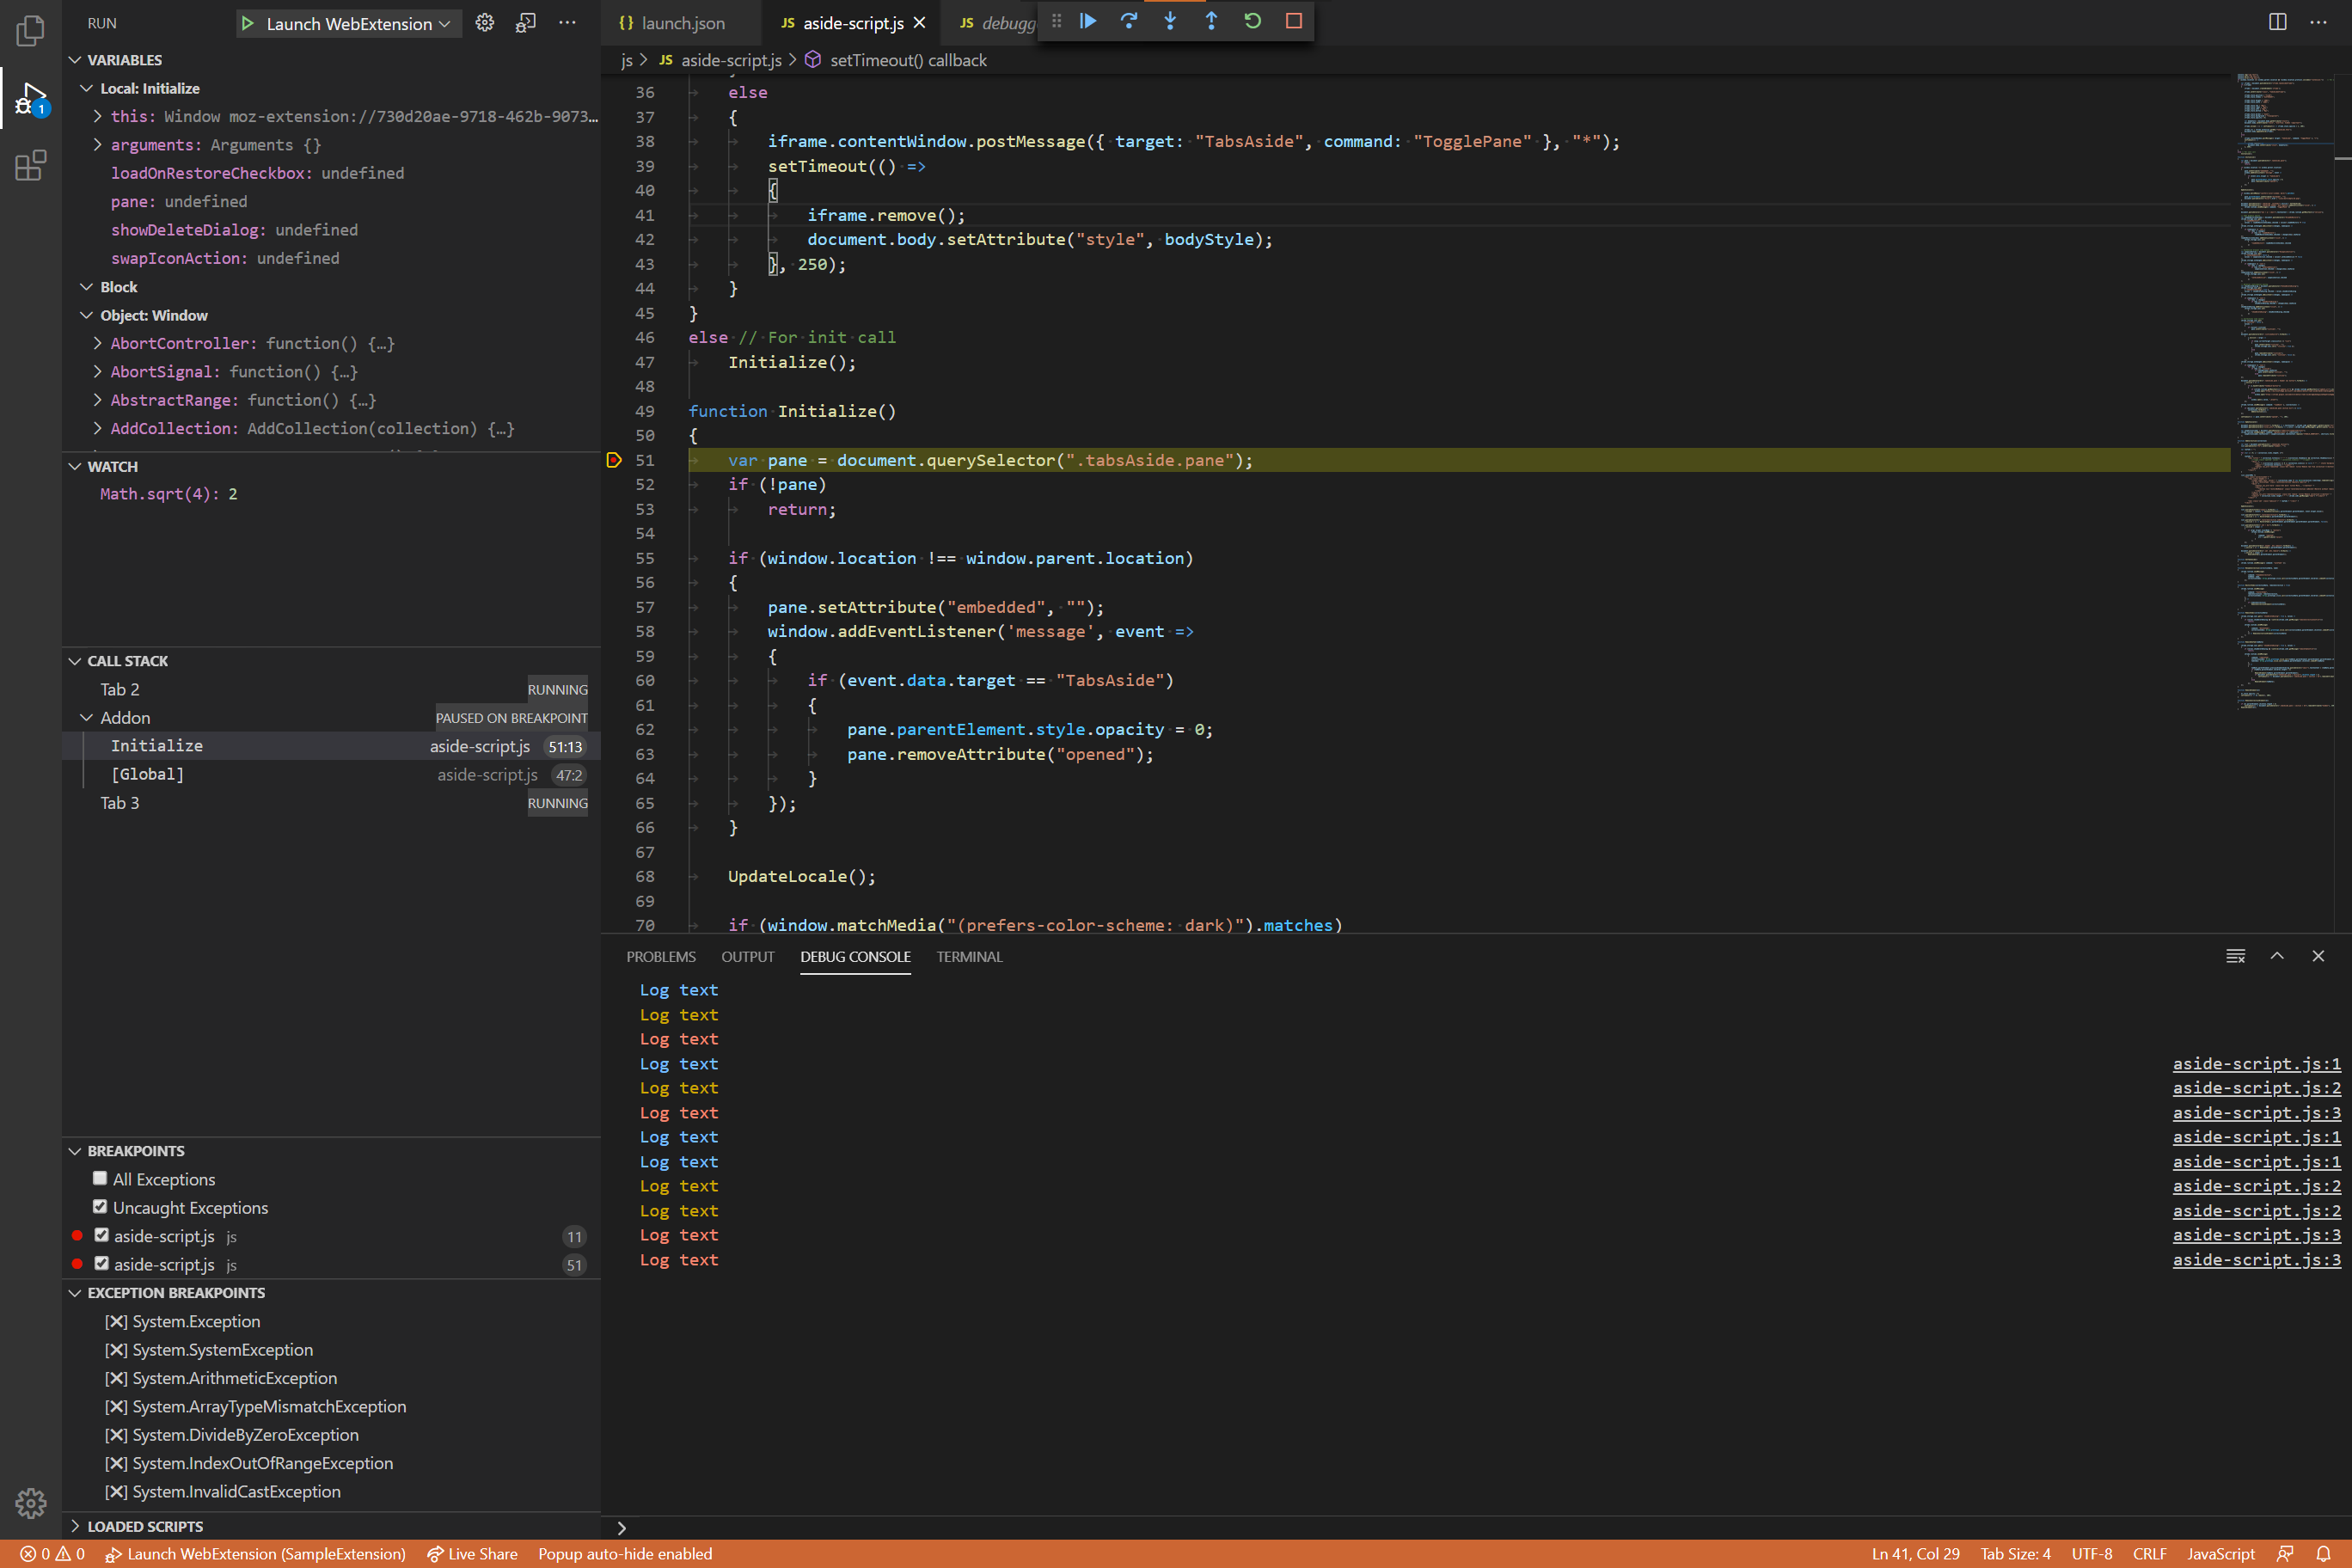
So that's it. Now you can use all power of Visual Studio Code for extensions development
Conclusion
Hope this article will help you with your own project. If you still have any questions left, feel free to ask them in the comment section below. You can also leave a topic suggestion for my next article in the comment section as well
Next time I'll write about configuring a CI/CD pipeline for WebExtension with GitHub Actions
If you like ❤️ this, you can Buy Me a Coffee ☕ or follow me on Twitter 🗨. Thanks for your time ;)
Cheers,
XFox 🦊